
Using column chart reports
Overview
Column chart reports help visualize activity metrics as vertical bars plotted across a timeline or grouping. Each column represents the value of a metric for a specific interval, making it easy to compare volumes across different time periods or categories at a glance.
They are typically used to monitor activity volumes over time and to compare how engagement or event counts differ across days, weeks, or other intervals.
This type of report makes it easy to spot busy periods, quiet stretches, or significant spikes in campaign interactions and contact behavior.
When to use a column chart report
You can use a column chart report when you need to compare activity volumes across discrete time intervals or groupings.
Here are some example cases where a column chart report can be used:
- Compare the number of emails sent across different days or weeks in a campaign period
- Review how contact signups or conversions are distributed over time
- Break down e-commerce events or Talk conversation volumes by interval to identify high-activity periods
Creating column chart reports
You can create a column chart report by selecting Analytics > Reports > +New Person/Account Report > Start from scratch > Column chart report.
When building the report:
- Click + Add metric to select the activity you want to report on.
- Click + Add another metric to include up to 9 total metrics.
- Use the table below to configure the report's settings in the editor.
- Select Create to build the report on the account.
Below is a table of the available setting options for this report:
Setting | Description |
|---|---|
Report Name | Sets the internal name of the column chart report, making it easy to identify in the reports list and dashboards. |
Add metric / Add another metric | Select the activity, contact field, or account field to use as a metric in the report. Learn more about field-based reports. |
+ Where | Add conditions to refine which activities or field values are included in the metric. |
Label | Sets the name for the metric in the column chart key. |
Aggregate by | Choose how the metric is calculated: Total count or Unique total count. Metrics with number or currency attributes can also be aggregated by Sum or Average. |
Attribute for aggregate | When aggregating by Sum or Average, select the number or currency attribute to calculate. |
Associate by | Appears when Aggregate by is set to Unique total count. Select the attribute that determines how activities are counted as unique. Learn more about uniqueness. |
Divide by another metric | Divide one metric by another to calculate a rate or ratio. E.g. divide unique Opened Email by unique Received Email activities for an open rate. Learn more about campaign statistics. |
Display As | When dividing metrics, choose whether the result is displayed as a Rate (%) or a standard value. |
Filter results by | Apply additional filters to limit which contacts are included, such as audience membership, field values, or tags. |
Group by attribute or field | Group columns by a contact or account attribute to break down the metric across different values, such as plan type or region. |
Timeframe | Sets the date range for the report. Only activities within this window are included. |
Precision | Defines the time unit used to group and display activity data in the report. |
Uniqueness Window | Appears when Aggregate by is set to Unique total count. Determines how often the same contact can be counted for the same activity. This prevents duplicate activity events from inflating results within a defined time period. Learn more about uniqueness windows. |
Show trendline | Adds a trendline to the chart to highlight the overall direction or pattern of the data over time. |
Display values | Displays the exact metric values above each column so the specific counts are visible without hovering. |
Show cumulative data | Displays values as a running total across the selected timeframe, showing how the metric aggregates over time. |
Stacked values | When multiple metrics are added, stacks them within each column rather than displaying them side by side, making it easier to see the combined total alongside the individual breakdown. |
Display empty attribute values as unknown | Includes records that do not have a value for the selected attribute and groups them under Unknown so they remain represented in the chart. |
Exclusions | Allows you to remove contacts in your suppression list from your report, such as internal users or test contacts, to keep your results clean and accurate. Learn more about the email suppression list. |
TIP: When isolating a specific campaign using the + Where condition, apply the same condition to all metrics in the chart to ensure the results are accurate and comparable.
Interpreting column chart reports
A column chart report displays activity metrics as vertical bars plotted across a timeline. The chart is made up of time intervals along the horizontal x-axis and metric values along the vertical y-axis.
Each column represents the calculated value of a metric for a specific time interval within the selected timeframe. When multiple metrics are added, each metric is displayed as a separate column in a distinct color at each interval. If Stacked values is enabled, the metrics are combined into a single column per interval, with each metric shown as a distinct segment within it.
Hovering over any column on the chart will display the metric value and the corresponding time interval for that data point.
Understanding the timeline (X-axis)
The horizontal axis represents the time intervals used to group activity data. The intervals are determined by the Precision setting.
For example:
- Hour groups activities into hourly intervals.
- Day groups activities into daily intervals.
- Week groups activities into weekly intervals.
- Bi-weekly groups activities into two-week intervals.
- Month groups activities into monthly intervals.
Each column on the chart represents the calculated metric value for that specific time interval.
Understanding the metric value (Y-axis)
Each column in the chart represents a metric added to the report. The vertical axis shows the value of that metric for each time interval.
Depending on the configuration, a metric may show:
- The total count of matching activities or records.
- The unique total count, where each contact is counted once based on the selected association.
- A sum or average of a number or currency attribute.
- A rate or ratio when the metric is divided by another metric.
Comparing column heights across the timeline makes it easy to identify which intervals had the highest or lowest activity. When multiple metrics are displayed, comparing bars side by side helps identify how different activities relate to each other within the same interval.
NOTE: Reports are built using existing activity data. The data available in a report depends on each activity's data retention settings. Learn more about data retention.
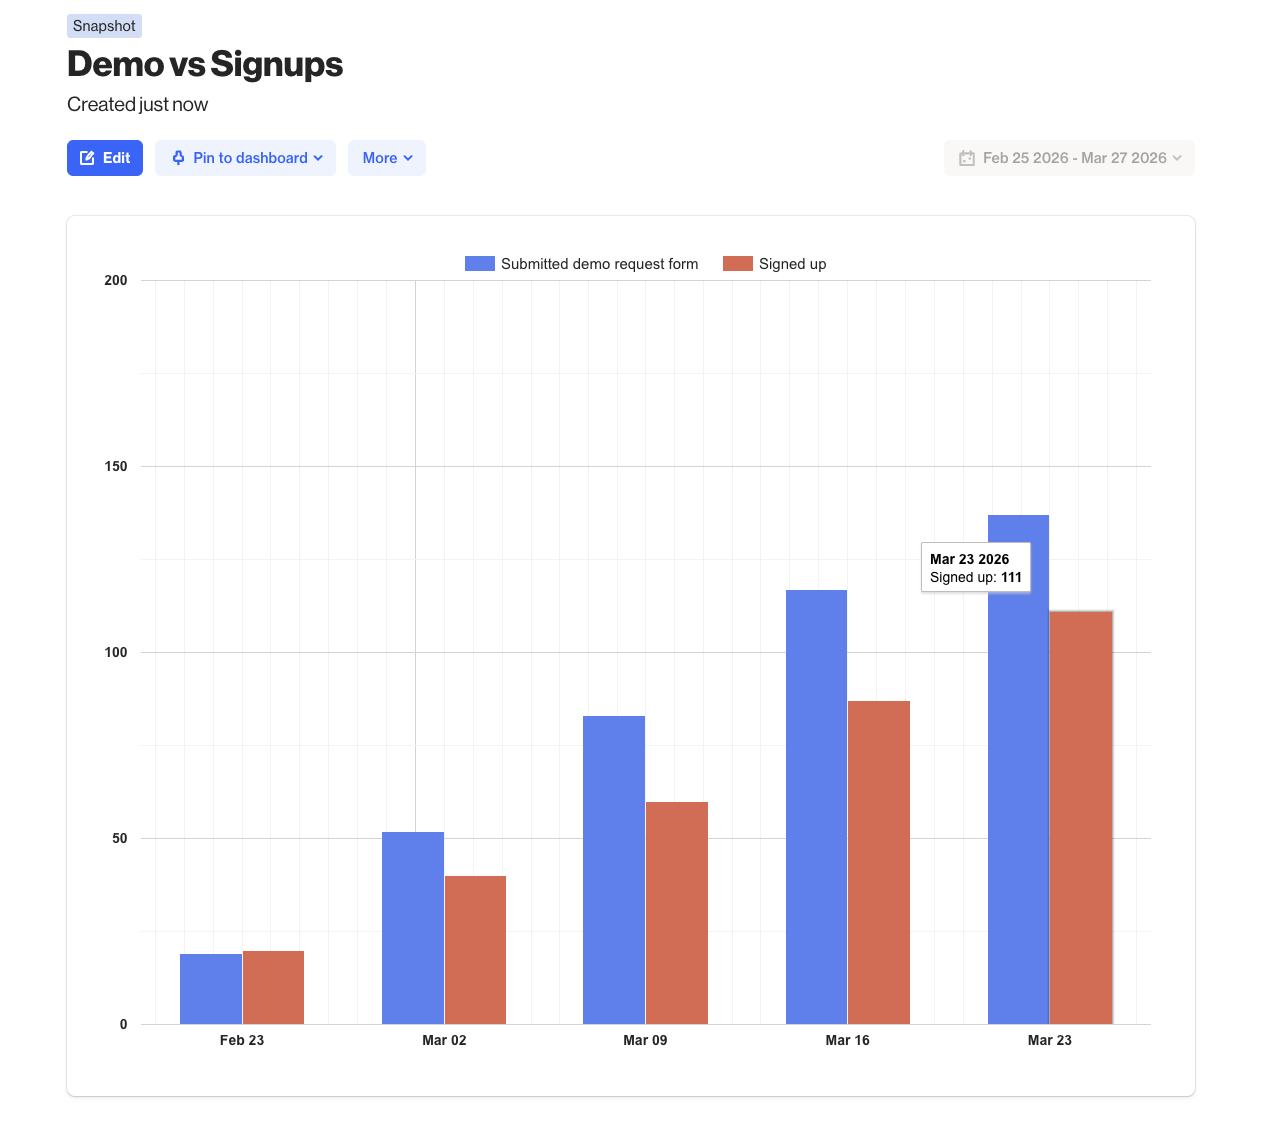
EX: This column chart report compares Submitted demo request form (blue) and Signed up (red) over the last 30 days, grouped by week with Show cumulative data enabled. Both metrics grow steadily across the period, with demo form submissions consistently outpacing signups. By the week of March 23, submissions reach around 135 while signups reach 111.