
How campaign statistics are calculated
Overview
Learn more about how campaign, message, and notification statistics are calculated. The data on a campaign's Report page, journey shape preview, and messages tab provide insights into the status and performance of your campaigns and messages
Explore the tables below to learn how we calculate the statistics for:
- SMS.
IMPORTANT:
- Non-human interactions, like server opens or clicks from Apple's MPP service, are currently included in your report totals. We cannot exclude these server opens without also missing real opens. Our deliverability team is actively monitoring this issue to provide the most accurate data possible.
- However, we do exclude known machine opens for Google and Yahoo, as well as clicks within 5 seconds of sending (10 seconds for Internet Explorer 8), to avoid mistakenly filtering out genuine interactions.
NOTE: Unique.
- When you see Unique in the descriptions, it means each email, SMS, or push notification sent within a 24-hour period is assigned a unique ID. This helps us track activities for each specific message or notification.
NOTE: Sent vs. delivered.
- Sent: This means the message or notification was successfully sent from our system, like when we use Sendgrid to send an email. It doesn’t guarantee delivery.
- Delivered: This means we’ve received confirmation from the service provider that the message or notification was successfully received.
Journeys
This table describes the statistics shown in a journey at:
- A message or notification shape’s preview.
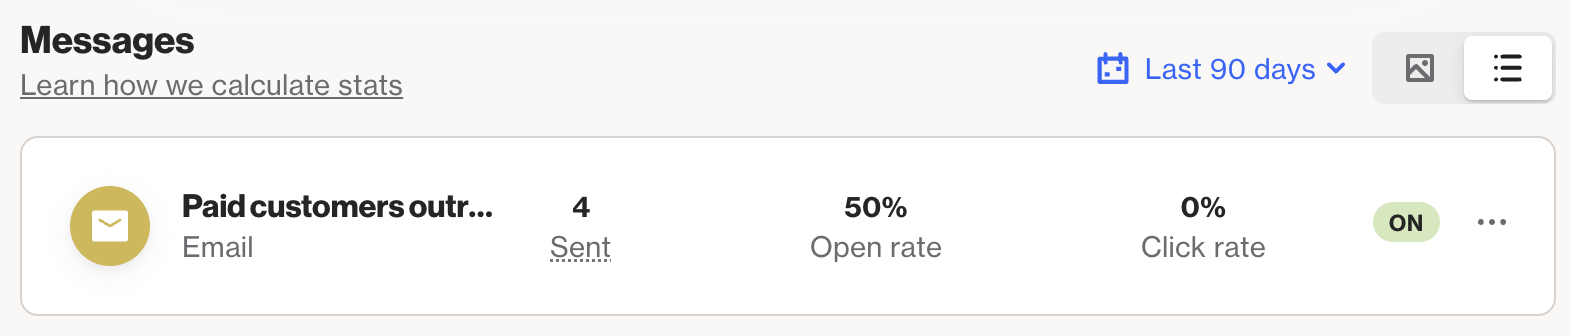
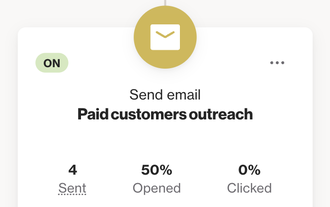
- The Messages tab.
- The Report tab.
For information on additional message/notification statistics, refer to the relevant table (email, SMS or push notifications).
Statistic | Description |
|---|---|
Sent | The amount of unique email or SMS messages or push notifications that were sent. A send refers to each unique email, SMS, or push notification sent within a 24-hour period.
|
Opened / Open rate | The open rate tracks how many times a message is opened, with a default 30-day window for counting each unique message.
|
Clicked / Clicked rate | A click is counted each time a unique message or notification is clicked.
|
Waiting | This metric shows the number of people who have reached a step in the journey but have not yet received the message or notification. |
Winning | In an A/B test, the version with the highest open rate, click rate, or total attributed revenue is considered the best-performing version. |
Remain | This is the count of individuals within the test group who have not received either variant A or variant B of the A/B test. |
Entered | The number of people who entered the journey. |
In journey | The number of people currently in the journey. |
Exited | The number of people who have exited the journey. |
Revenue / MRR / ARR | This is the total sum of revenue attributed to this campaign or message based on your attribution settings. |
Other stats | See the email, SMS and push notifications tables for additional statistics. |
Playbooks
This table describes the statistics shown in a playbook at:
- The Messages tab.
- The Report tab.
For email message statistics, refer to the relevant table for more information.
Statistic | Description |
|---|---|
Opened / Open rate | The open rate tracks how many times a message is opened, with a default 30-day window for counting each unique message.
|
Clicked / Click rate | A click is counted each time a unique message or notification is clicked.
|
Revenue / MRR / ARR | This is the total sum of revenue attributed to this campaign or message based on your attribution settings. |
Entered | The number of people who entered the playbook. |
In playbook | The number of people currently in the playbook. |
Exited | The sum of people who have exited the playbook. |
Emails
This table describes the statistics shown:
- In an email campaign, at the Report tab.
- In a journey containing an email message shape, at the Report tab, under Email summary.
Statistic | Description |
|---|---|
Open rate / Opened | The open rate tracks how often a message is opened. By default, we count only one open per message within a 30-day period.
|
Click rate / Clicked | This metric shows the number of unique email messages that were clicked.
|
Conversions / Orders | The sum of activities attributed to the campaign where the attribution activity has a conversion value attribute. |
Conversion rate | The percentage of conversions attributed to the campaign or message. Formula: (Conversions / Emails delivered) * 100 |
Revenue / MRR / ARR | This is the total sum of revenue attributed to the campaign or message based on your attribution settings. |
Sent | This metric shows the number of successful email deliveries.
|
Delivered | This metric shows the number of emails successfully delivered.
|
Last opened | The date and time the last subscriber opened the email. |
Click-to-open rate | The percentage of unique email messages that were opened and the subscriber clicked inside. Formula: (Unique clicks / Emails delivered) * 100 |
Viewed online | The amount of times this campaign was viewed using the “View online” link. Displayed as a sum and a percentage. Formula: (Emails viewed online / Emails delivered) * 100 |
Unsubscribed | The amount of subscribers who unsubscribed from all email. Displayed as a sum and a percentage. Formula: (Email unsubscribes / Emails delivered) * 100 |
Invalid | The percentage of people for whom the send was invalid (e.g. there was an issue with the message content, a delivery issue, an unsubscribe activity, or the person’s phone number value was empty). Displayed as a sum and a percentage. Formula: (Invalid emails / Invalid emails + Emails sent) * 100 |
Bounced | The percentage of people for whom the send bounced (e.g. the message delivery was rejected by the SMS provider). Displayed as a sum and a percentage. Formula: (Bounced emails / Emails delivered) * 100 |
Last clicked | The date and time the last subscriber clicked a link. |
Forwarded | The amount of forwards of this email using the “Forward” feature. Displayed as a sum and a percentage. Formula: (Forwarded emails / Emails delivered) * 100 |
Sentiment | The overall sentiment (positive or negative) of the email based on reactions. Positive formula: (Positive responses / ((Positive responses + Negative responses) * 10000) ) / * 10000 Negative formula: (Negative responses / ((Positive responses + Negative responses) * 10000) ) / * 10000 A breakdown of each reaction option’s stats is available further down the Report tab, under Reactions. |
Spam complaints | People who lodged a spam complaint for the email sent. Displayed as a sum and a percentage. Formula: (Spam complaints / Emails delivered) * 100 |
Reacted | People who reacted to the email using the reaction widget. Displayed as a sum and a percentage. Formula: (Email reactions / Emails delivered) * 100 |
SMS
This table describes the statistics shown:
- In an SMS campaign, at the Report tab.
- In a journey containing an SMS message shape, at the Report tab, under SMS summary.
Statistic | Description |
|---|---|
Sent | The amount of successful sends for this SMS message. This stat does not include messages sent where the send was invalid, bounced, or deferred. Displayed as a sum and a percentage. Formula: (SMS sent / Invalid SMS + SMS sent * 100) |
Delivered / Delivery rate | The amount of successful deliveries for this SMS message. Displayed as a sum and a percentage. Formula: (SMS delivered / SMS sent) * 100 |
Clicked / Click rate | Delivered SMS messages where there is a click. Displayed as a sum and a percentage. Formula: (Unique clicks / SMS delivered) * 100 |
Confirmed | People who responded to the confirmation widget. Displayed as a sum and a percentage. Formula: (Confirmations / SMS delivered) * 100 |
Responded to survey | The amount of people who responded to the SMS survey. Displayed as a sum and a percentage. Formula: (Survey responses / SMS delivered) * 100 |
Response rate | The percentage of people who responded to a particular widget (survey or confirmation). Survey formula: (Survey responses / SMS delivered) * 100 Confirmation formula: (Confirmations / SMS delivered) * 100 |
Unsubscribed | The amount of subscribers who unsubscribed from all SMS. Displayed as a sum and a percentage. Formula: (Opted out of SMS / SMS delivered) * 100 |
Invalid | The amount of people for whom the send was invalid. Displayed as a sum and a percentage. Formula: ( Invalid SMS / SMS sent + Invalid SMS) * 100 |
Bounced | The amount of people for whom the send bounced (e.g. the message delivery was rejected by the SMS provider). Displayed as a sum and a percentage. Formula: ( Bounced SMS / SMS delivered + Bounced SMS) * 100 |
Replied | People who replied to the SMS message. Displayed as a sum and a percentage. Formula: (SMS replies / SMS delivered) * 100 |
Deferred | The amount of people for whom the send was deferred (e.g. the message delivery was temporarily refused by the SMS provider). Displayed as a sum and a percentage. Formula: (Deferred SMS / SMS delivered) * 100 |
Converted / Orders | The number of activities attributed to the campaign or message where the attribution activity has a conversion value attribute. |
Conversion rate | The percentage of conversions attributed to this campaign or message. Formula: (Conversions / SMS delivered) * 100 |
Revenue / MRR / ARR | This is the total sum of revenue attributed to this campaign or message based on your attribution settings. |
Push notifications
This table describes the statistics shown:
- In a push campaign, at the Report tab.
- In a journey containing a push notification shape, at the Report tab, under Push notification summary.
Statistic | Description |
|---|---|
Unique sends | The amount of successful unique push notification sends. A “send” is counted per unique notification sent per 24 hours. This stat does not include messages sent where the send was invalid or bounced, or the person was not subscribed. Displayed as a sum and a percentage. Formula: (Unique sends / (Unique sends + Unique invalid sends)) * 100 |
Delivered / Delivery rate | The amount of successful unique push notification deliveries. A “delivery” is counted per unique notification delivered per 24 hours. Displayed as a sum and a percentage. Formula: (Unique deliveries / Unique sends) * 100 |
Revenue / MRR / ARR | This is the total sum of revenue attributed to the campaign or notification based on your attribution settings. |
Converted / Orders | The sum of activities attributed to the campaign or notification where the attribution activity has a conversion value attribute. |
Conversion rate | The percentage of conversions attributed to this campaign or notification. Formula: (Conversions / Unique deliveries ) * 100 |
Clicked / Click rate | The amount of unique notification deliveries where there is a click. We only count 1 click per unique delivery. So if a person clicks the same notification twice in a 24-hour period, we will only count 1 click. Displayed as a sum and a percentage. Formula: (Unique clicks / Unique deliveries) * 100 |
Unique invalids | The amount of unique invalid sends for this campaign or notification. Displayed as a sum and a percentage. Formula: (Unique invalid sends / (Unique sends + Unique invalid sends)) * 100 |
Unique deliveries | The amount of unique deliveries for this campaign or notification. Displayed as a sum and a percentage. Formula: (Unique deliveries / Unique sends) * 100 |
Unique clicks | The amount of unique clicks for this campaign or notification. Displayed as a sum and a percentage. Formula: (Unique clicks / Unique deliveries) * 100 |
Total sent | The total amount of sends for this campaign or notification. Displayed as a sum and a percentage. Formula: (Notifications sent / Notifications sent + Invalid notification sends)) * 100 |
Total invalid | The total amount of invalid sends for this campaign or notification. Displayed as a sum and a percentage. Formula: (Invalid notification sends / Invalid notification sends + Notifications sent)) * 100 |
Total delivered | The total amount of deliveries for this campaign or notification. Displayed as a sum and a percentage. Formula: (Notifications delivered / Notifications sent) * 100 |