
Using funnel reports
Overview
Funnel reports show how contacts move through a defined sequence of activities. These reports measure how many contacts complete each step and how many continue to the next step in the sequence.
This makes it easier to evaluate conversion performance, identify where contacts drop off, and understand how effectively contacts progress through key stages of a campaign or lifecycle.
Funnel reports can be used to analyze campaign effectiveness, optimize journeys, and identify bottlenecks that may be preventing contacts from progressing.
NOTE: Unlike some other report types, funnel reports do not aggregate data beyond the specified retention period.
For example, if data retention for the activity being used within the report is set to 90 days, then the report will never show data beyond the last 90 days.
When to use a funnel report
You can use a funnel report when you want to measure how contacts move through a series of actions and understand where drop-off occurs between steps.
Here are some example cases where a funnel report can be used:
- Analyze how many contacts who registered for an event went on to attend afterward
- Measure how many leads who submitted a form went on to book a demo
- Track how many contacts who started a free trial went on to convert to a paid subscription
TIP: Funnel reports can be useful when reviewing onboarding campaign performance across multiple stages. They make it easier to identify where contacts disengage so you can optimize messaging, timing, or targeting to improve conversions.
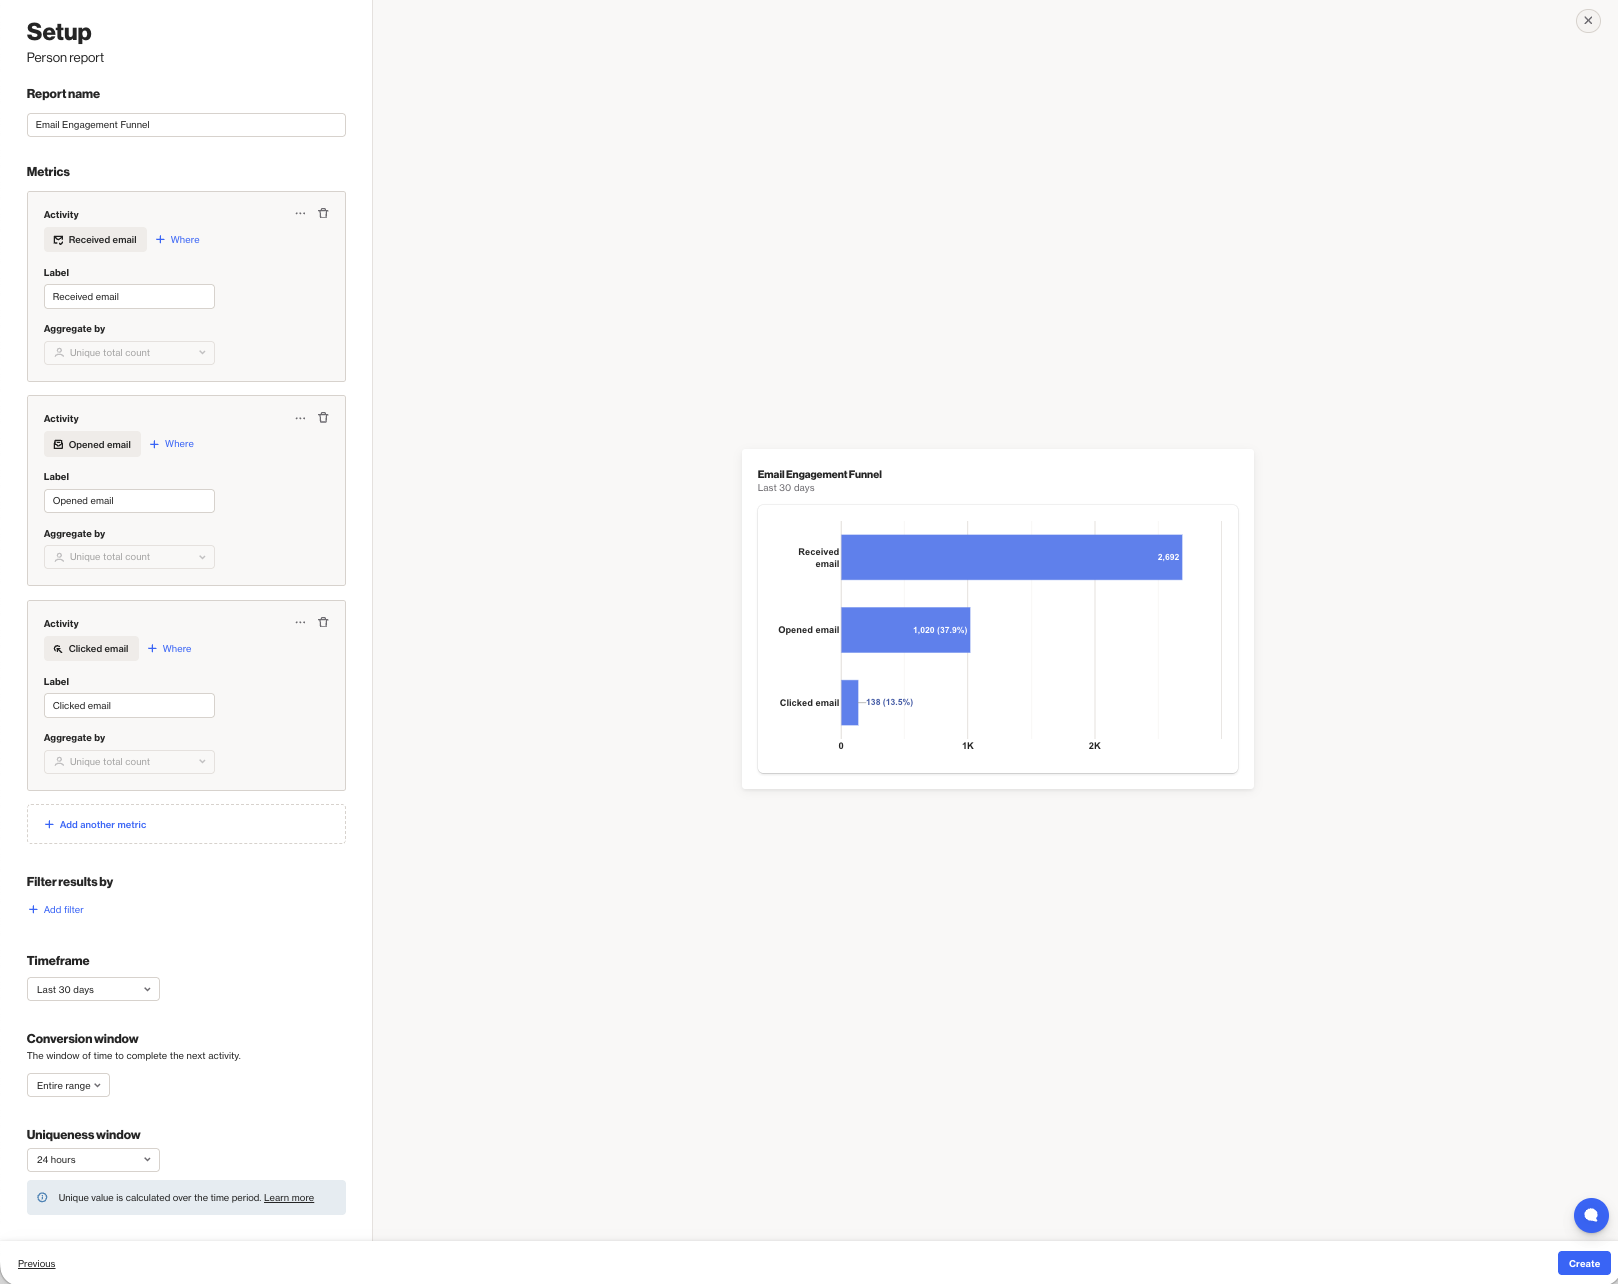
Creating funnel reports
You can create a funnel report by selecting Analytics > Reports > + New Person/Account Report > Start from scratch > Funnel report.
When building the report:
- Click + Add metric to define the first activity in the funnel.
- Click + Add another metric to add up to 4 additional steps and define the sequence of activities you want to measure.
Each metric represents a step in the funnel that contacts must complete to progress to the next stage.
To remove a step, click the trash icon beside that activity. You can rearrange the order of the steps in the settings panel by dragging and dropping them into your preferred sequence.
Once configured, select Create to build the report on the account.
NOTE: Activities must be listed in the report in the same order they are intended to occur. Contacts only progress through the funnel when they complete the activities in that defined sequence.
Below is a table of the available setting options for this report:
Setting | Description |
|---|---|
Report Name | Sets the internal name of the funnel report, making it easy to identify in the reports list and dashboards. |
+ Add metric / Add another metric | Select the activity used for each step in the funnel. Each metric represents a stage that contacts must complete to progress to the next step.Up to 5 metrics are supported in total. |
+ Where | Add conditions to refine which activity events qualify for that step in the funnel. |
Label | Sets the name displayed for the step in the funnel report. |
Aggregate by | This report type supports aggregating by unique total count, measuring how many unique contacts completed each step. Learn more about uniqueness. |
Filter results by | Apply additional filters to limit which contacts are included, such as audience membership, field values, or tags. |
Timeframe | Sets the date range for the report. Only activities within this window are included in the funnel analysis. |
Conversion window | Defines the amount of time contacts have to complete the next step in the funnel after completing the previous step. Supported options include: entire range, 30 days, 3 days, 1 day, 1 week, or 1 hour. |
Uniqueness Window | Determines how often the same contact can be counted for the same activity step. This prevents duplicate activity events from inflating results within a defined time period. Learn more about uniqueness windows. |
Exclusions | Allows you to remove contacts in your suppression list from your report, such as internal users or test contacts, to keep results clean and accurate. Learn more about the email suppression list. |
TIP: You can include field-based events in reports by enabling field tracking and using the custom activity generated for that field change as the activity in the report.
This allows you to analyze how contacts progress through stages such as lifecycle changes, lead status updates, or subscription preferences.
Learn more about field activity tracking.
Interpreting funnel reports
A funnel report is displayed as a series of steps that show how contacts progress through the defined activities.
Each step displays:
- The number of contacts who completed that activity
- For steps after the first, the percentage of contacts who progressed from the previous step is shown in parentheses.
This structure makes it easier to identify where contacts disengage within the funnel. You can also click on a step in the funnel to view the contacts included in that stage.
Understanding the steps
Each step represents a specific activity that contacts must complete to continue progressing through the funnel.
The first step includes all contacts who performed the selected starting activity within the selected timeframe.
Each subsequent step only includes contacts who completed the previous step and then performed the next activity.
Because contacts must complete each step in order, the number of contacts typically decreases as the funnel progresses.
NOTE: Reports are built using existing activity data. The data available in a report depends on each activity’s data retention settings. Learn more about data retention.
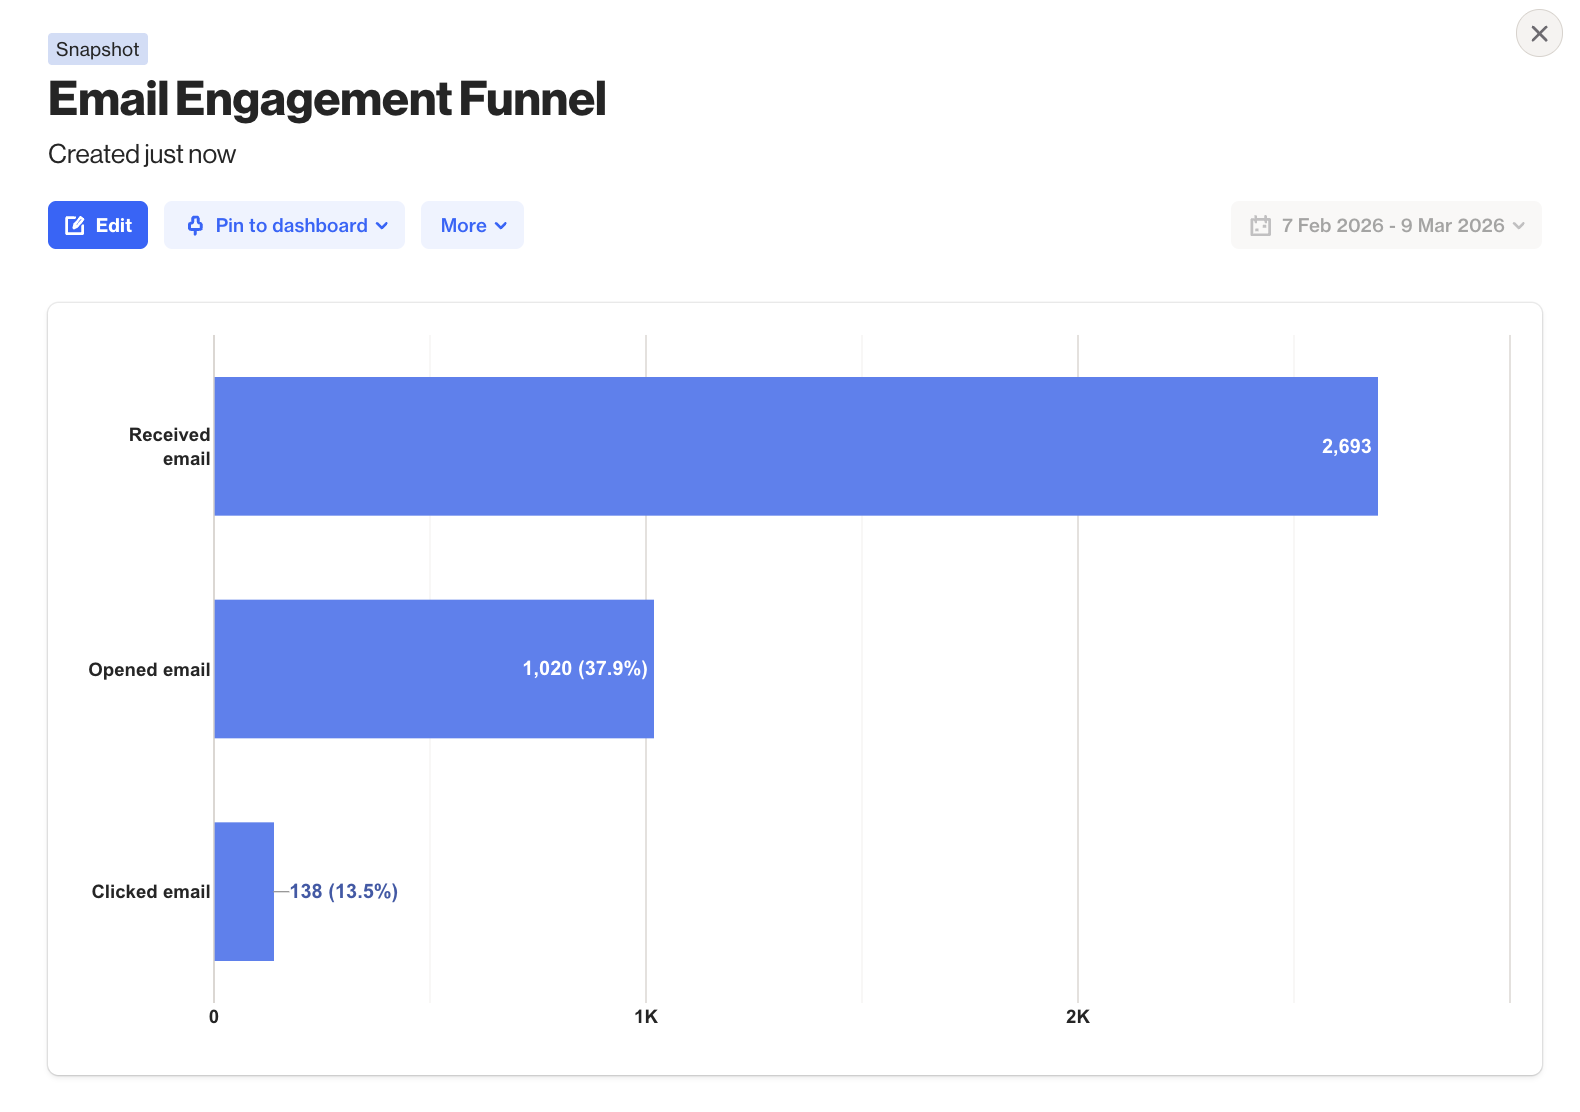
EX: This report shows that 2,693 contacts received an email in the last 30 days. Of those contacts, 1,020 opened the email, representing 37.9% of the contacts in the first step. Finally, 138 contacts clicked the email, which is 13.5% of those who opened it in the previous step.