
Using cohort reports
Overview
Cohort reports help you understand how contacts progress from one activity to another over time. Instead of looking at individual events, a cohort report groups contacts by the day they completed a starting action and then measures how long it takes for them to complete a follow-up action.
This makes it easier to spot patterns, delays, and drop-off points across groups of contacts who started at the same time.
When to use cohort reports
Use cohort reports when you need to track how groups of contacts progress over time, compare behavior across different start dates, and identify patterns such as drop-offs, retention changes, or delays between key actions.
Here are some example cases where a cohort report can be used:
- Track how long it takes new signups to make their first purchase.
- Compare retention between users who joined this month versus last month.
- Measure how quickly trial users convert to paid customers.
Creating cohort reports
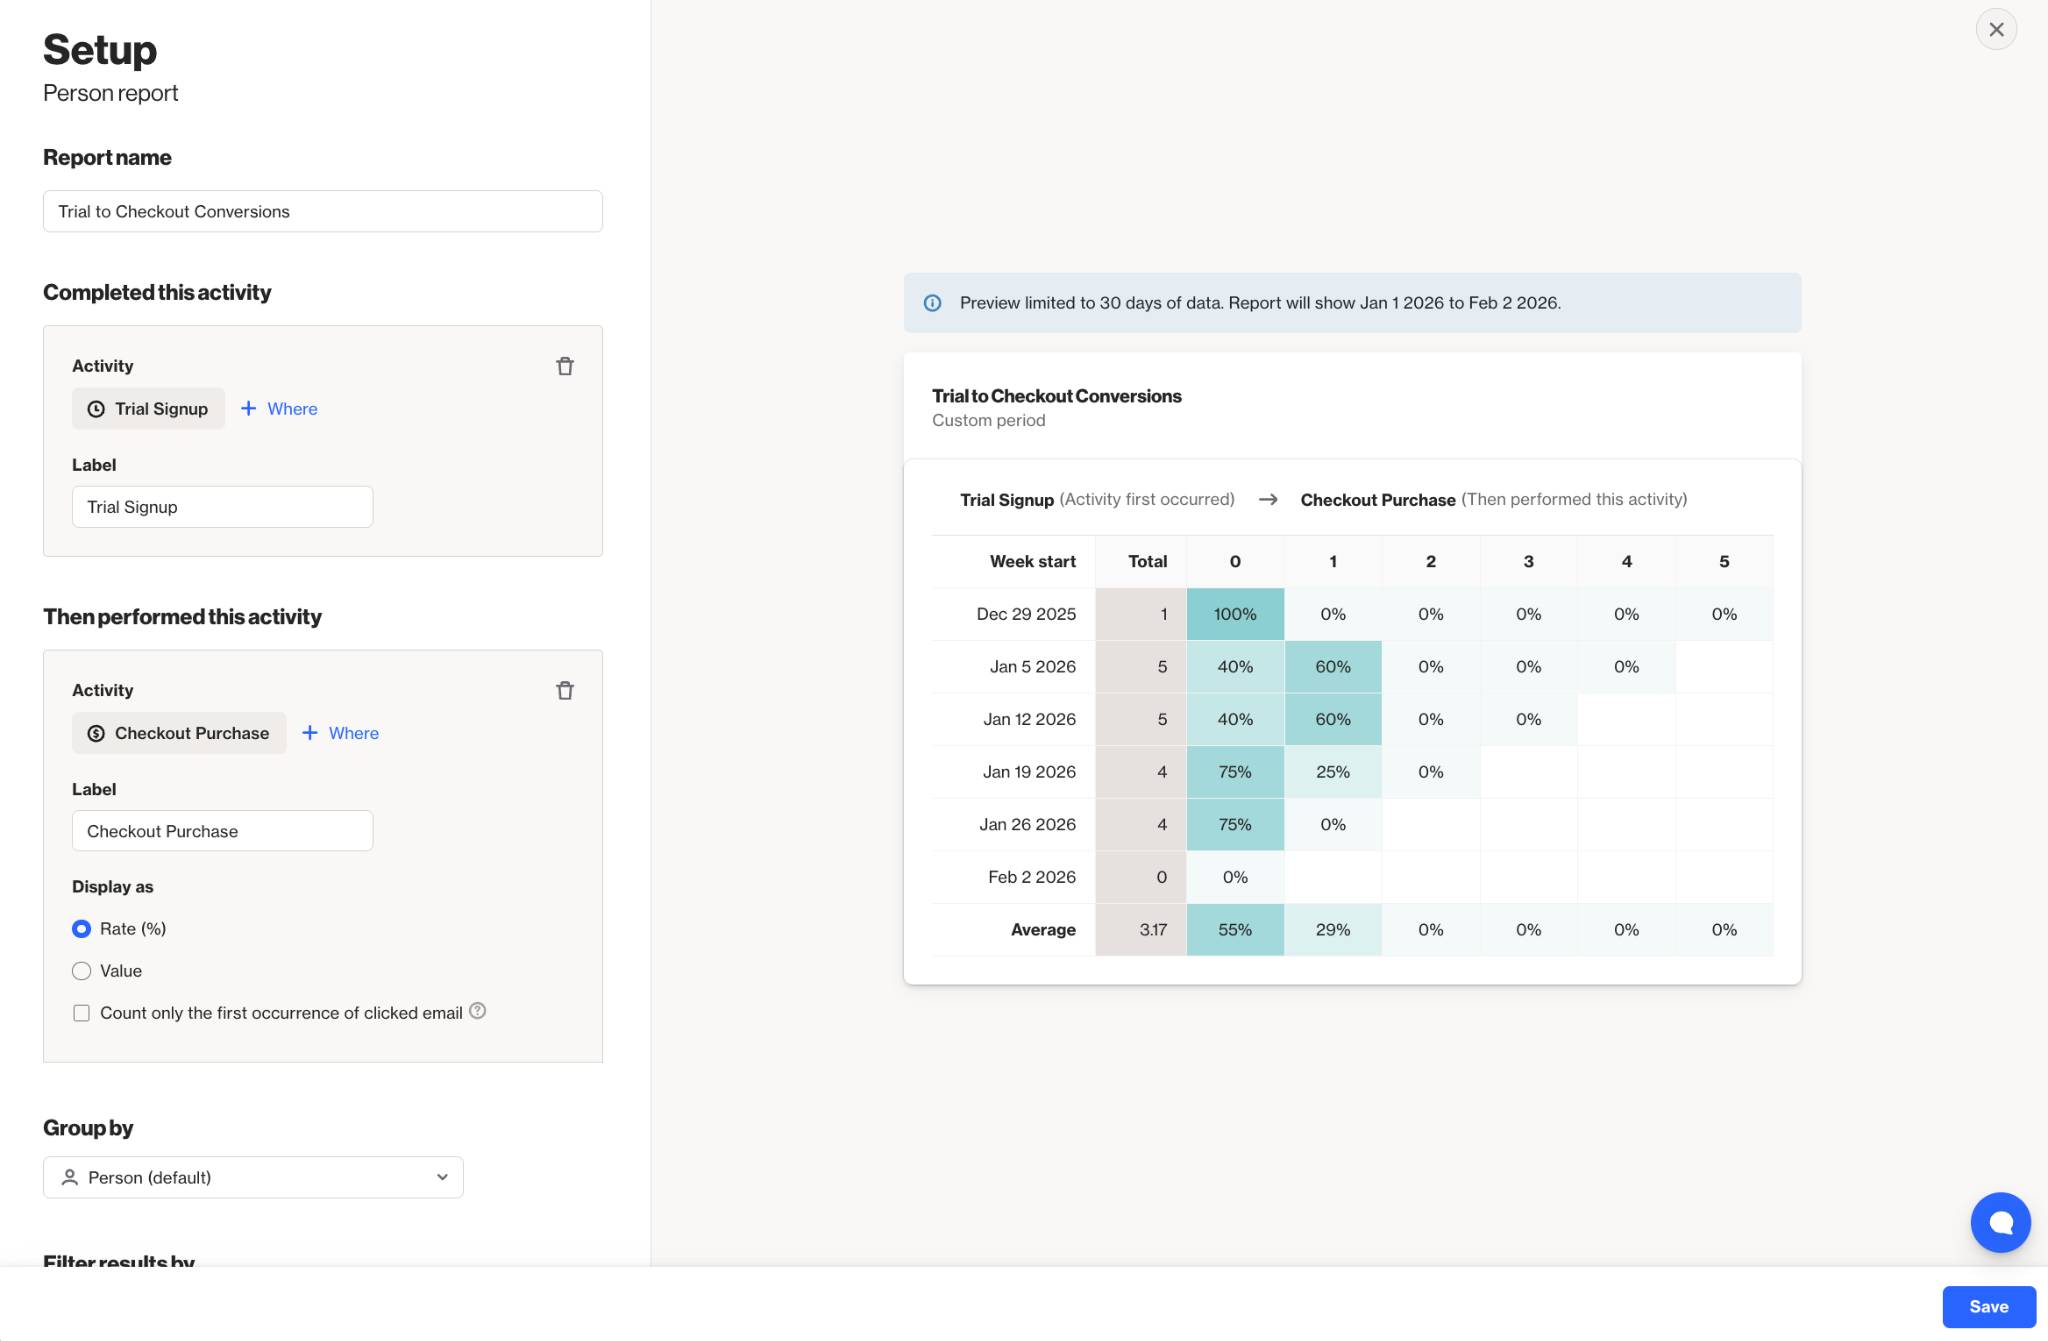
You can create a cohort report by selecting Analytics > Reports > +New Person/Account Report > Start from scratch > Cohort report.
When building the report:
- Click + Add metric to select the initial activity you want to report on.
- Click +Add metric under "Then performed this activity" to select the secondary activity
- Use the table below to configure the report's settings in the editor.
- Select Create to build the report on the account.
Below is a table of the available setting options for this report:
Setting | Description |
|---|---|
Report Name | Sets the internal name of your cohort report. This helps you identify the report in your reports list and dashboards. |
Completed this activity: | Defines the starting event for your cohort. Contacts are grouped based on when they first complete this selected activity. |
Then performed this activity: | Defines the follow-up event you want to measure. The report tracks how long it takes contacts from the starting cohort to complete this second activity. |
Group by | Controls how your activities are grouped. This is typically by Person. |
Filter results by | Lets you apply additional conditions to limit which contacts are included in the report, such as filtering by audience membership, field values, or activity properties. |
Timeframe | Sets the overall date range of data included in your report. Only activities that occur within this window are counted. |
Precision | Defines the time unit used to measure the delay between the first and second activity (for example, days or weeks). This controls how the time-based columns are calculated. |
Uniqueness Window | Determines how often the same contact can be counted for the same activity. This helps prevent duplicate activity events from inflating your cohort results within a defined time period. Learn more about the uniqueness window. |
Exclusions | Lets you remove specific contacts from your report, such as internal users or test data to keep your results clean and accurate. |
Interpreting cohort reports
A cohort report is displayed as a table made up of rows and columns:
- The Total column on the left shows how many contacts completed the first activity on a specific day.
- Each row represents a cohort of contacts who all started on the same date.
- The columns to the right represent how many days passed between the first activity and the second activity.
Each cell in the table shows how many contacts from that cohort completed the second activity after a certain number of days.
Understanding the start rows
Each row in the table represents a cohort of contacts whose first activity occurred on the specified date. All contacts in a row share the same starting point and are tracked forward from that moment.
Understanding the time columns
The numbered columns show how much time passed between the first activity and the second activity:
- A value of 0 means the contact completed the second activity within the same time period. For example, if the report is grouped by weeks, the second activity happened in the same week.
- A value of 1 means the contact completed the second activity in the next time period. For example, with weekly grouping, this means one week later.
- Empty cells indicate that no contacts completed the second activity during that time window.
Reading across a row shows how long it took contacts in that cohort to move from the first activity to the second.
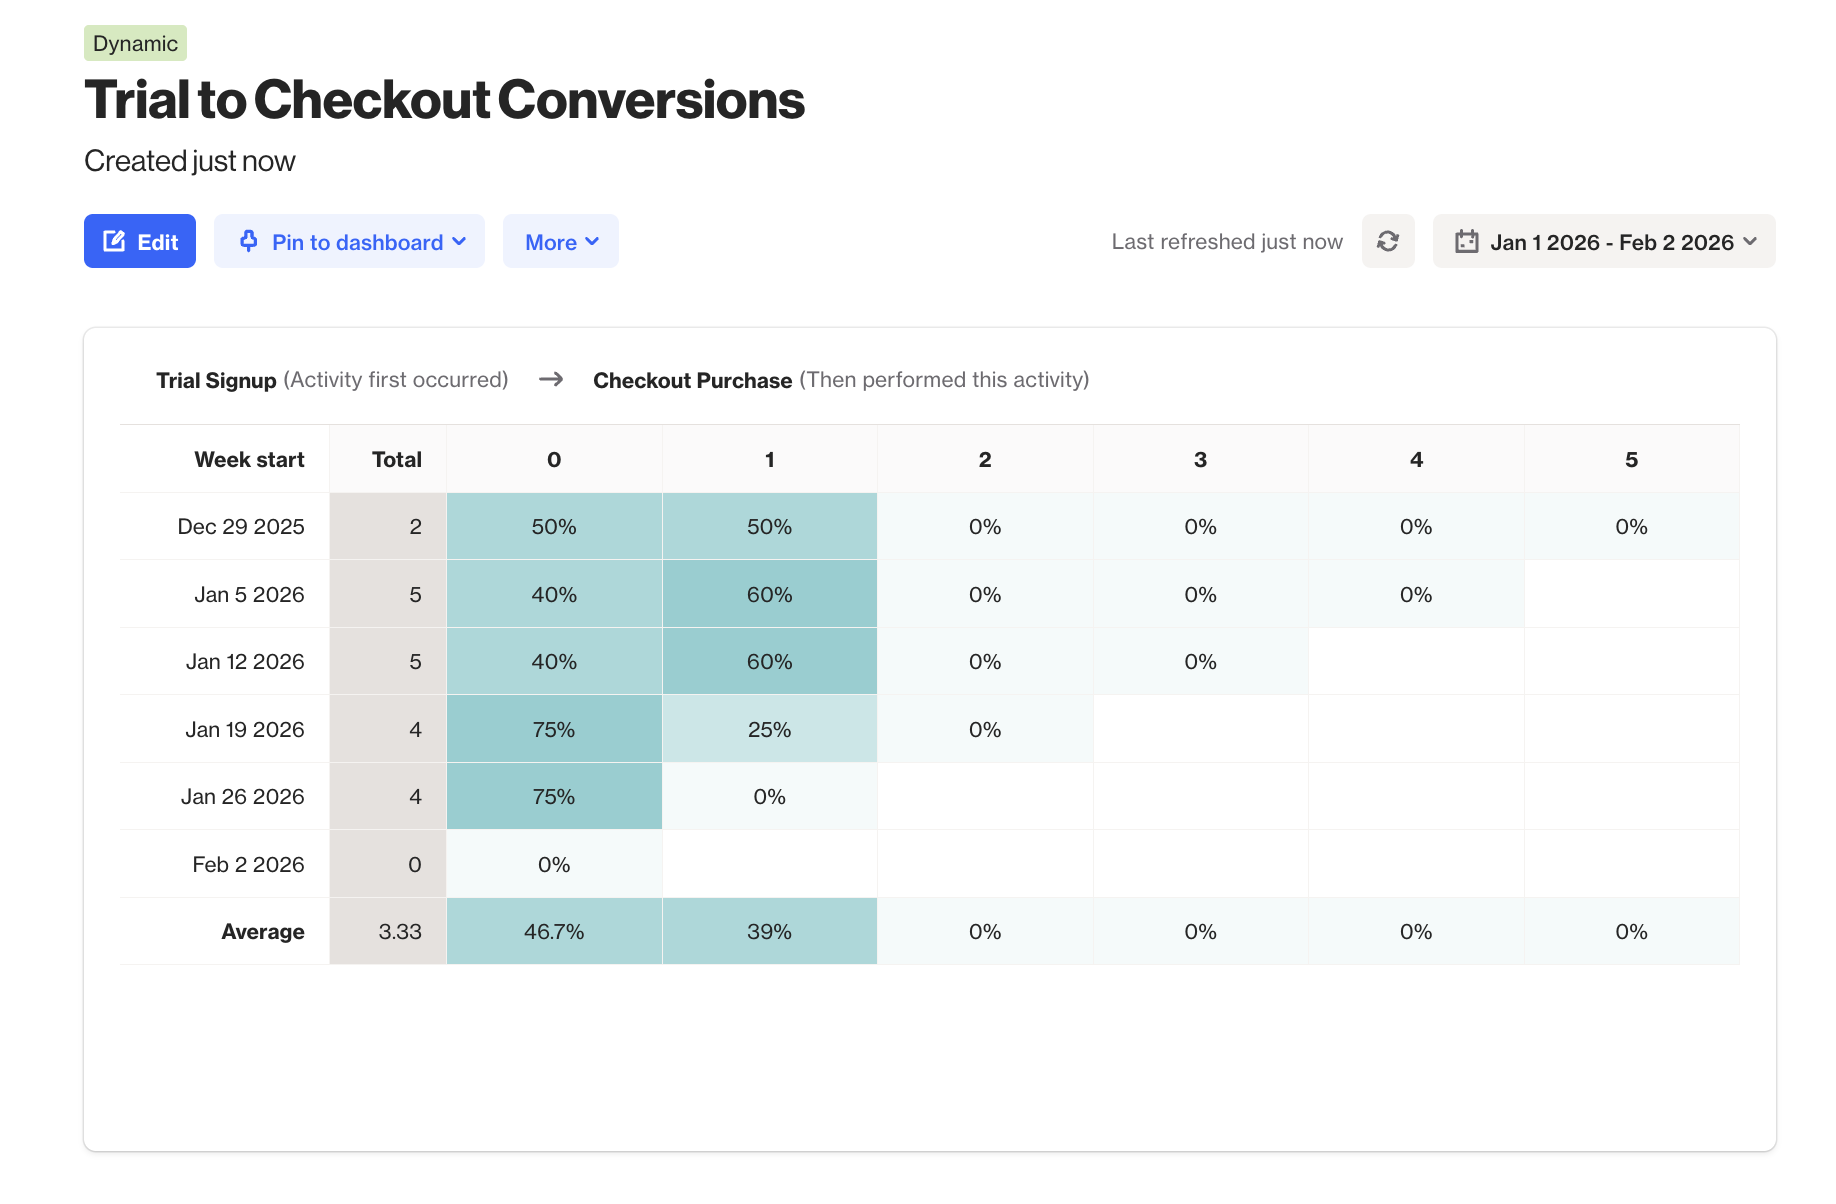
Example: The cohort report above indicates that 5 contacts had a Trial Signup occur the week of Jan 5. Of the contacts who entered that week, 40% of them had a Checkout Purchase activity occur within the same week 0 and 60% had the activity occur the following week.