
Creating and understanding a funnel report
Overview
A Funnel report shows how your contacts move through different stages, from their first interaction to final conversion. It helps you identify where potential customers are dropping off, so you can refine your strategies and improve conversions.
NOTE: The number of activities you can add to the funnel report depends on your plan:
- Professional: 5 activities
- Business: 10 activities
- Enterprise: 10 activities
Accessing funnel report
To access a funnel report go to Reports > New report > Start from scratch > Funnel
Managing funnel reports
Creating a funnel report
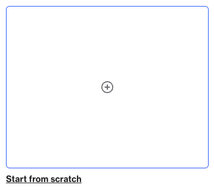
- On the Reports page, click New report > Start from scratch.
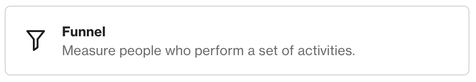
- Select Funnel then click Next.
- Name your report something memorable.
- Select the activities you'd like to measure with this funnel report.
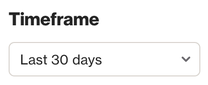
5. Select the timeframe you want to include in the report. Learn more about report timeframes.
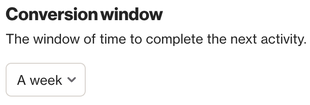
6. Select the conversion window that best suits your funnel. Learn more about the conversion window.
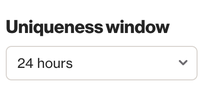
7. Select the appropriate uniqueness window. Learn more about the uniqueness window.
Understanding a funnel report
Order of the activities
The funnel report shows data based on the sequence of activities you've specified. This means that the contacts must complete these activities in the designated order for them to be included in the report.
EX: In the funnel report below, we have the following activities in order: Received email, Shown widget, and Checkout started.
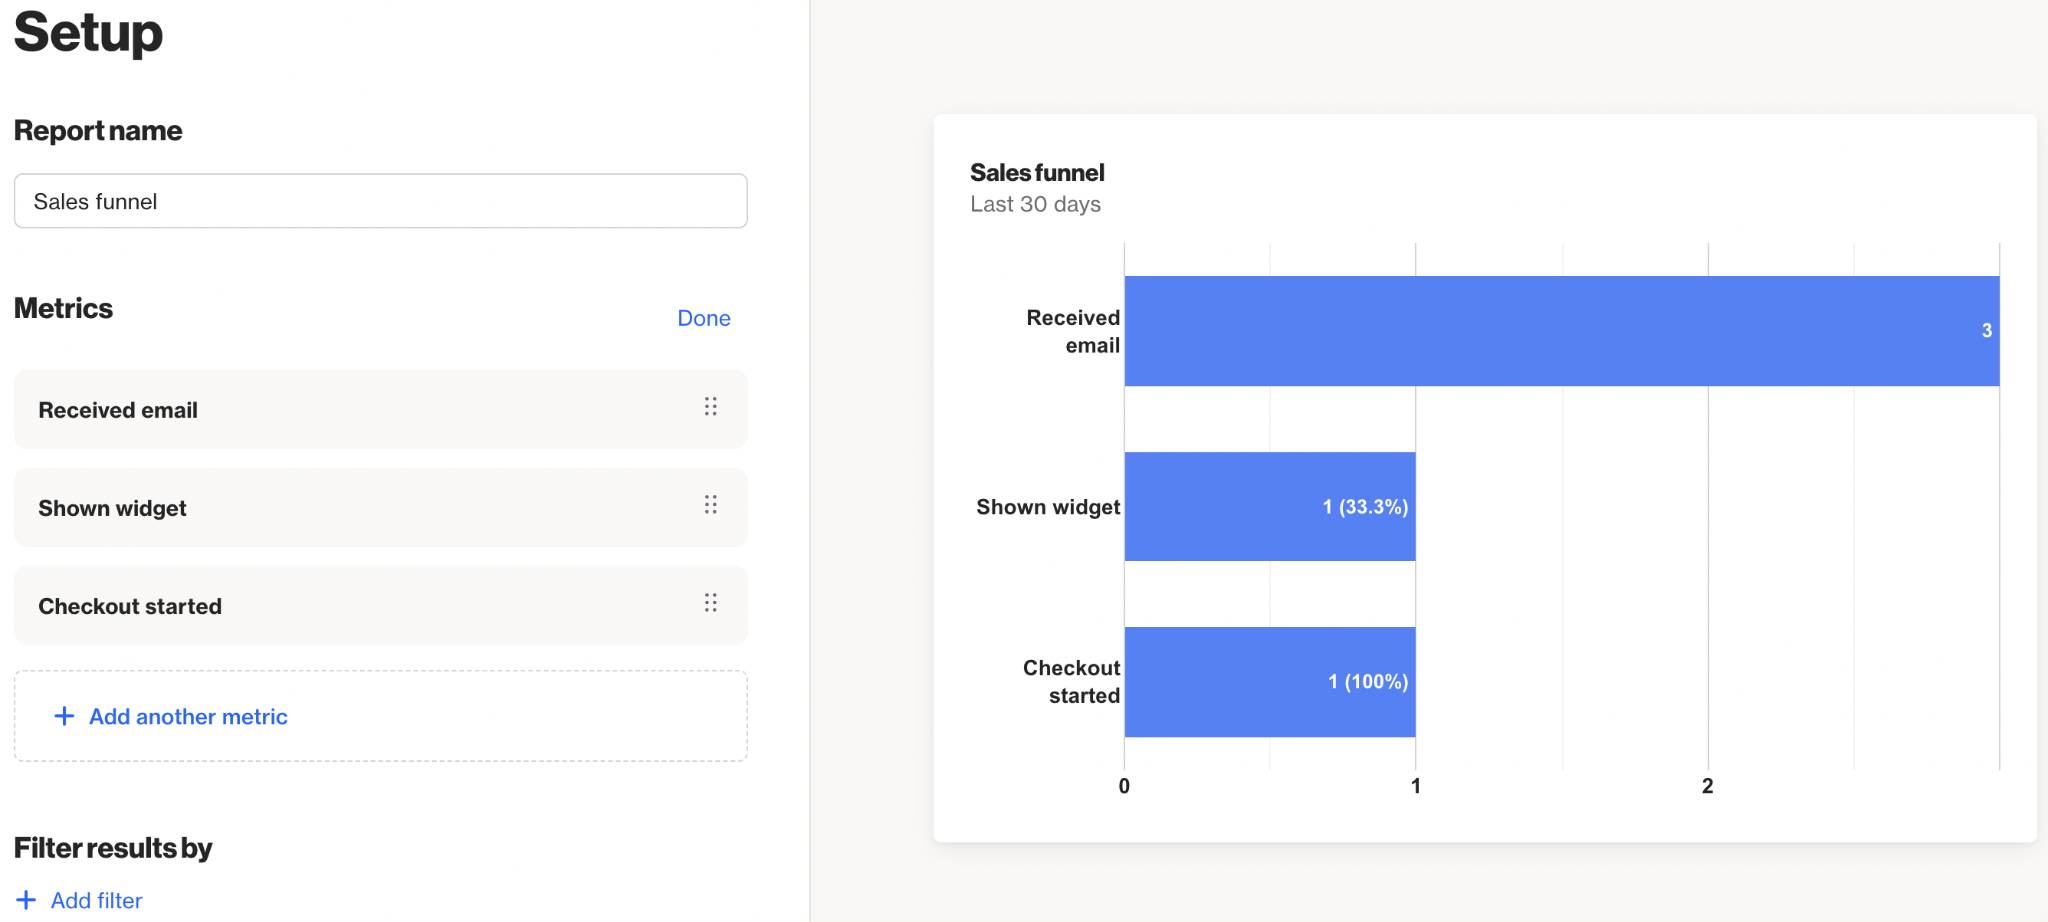
This means that if the widget was shown to a contact (Shown widget activity) but they didn't receive an email first (Received email activity), then that contact's activities won't be included in the report.
What the percentages represent
The percentages in each stage of the funnel correspond to the number of contacts who are in that stage after completing the stage above.
EX: In the funnel report below we have the following percentages:
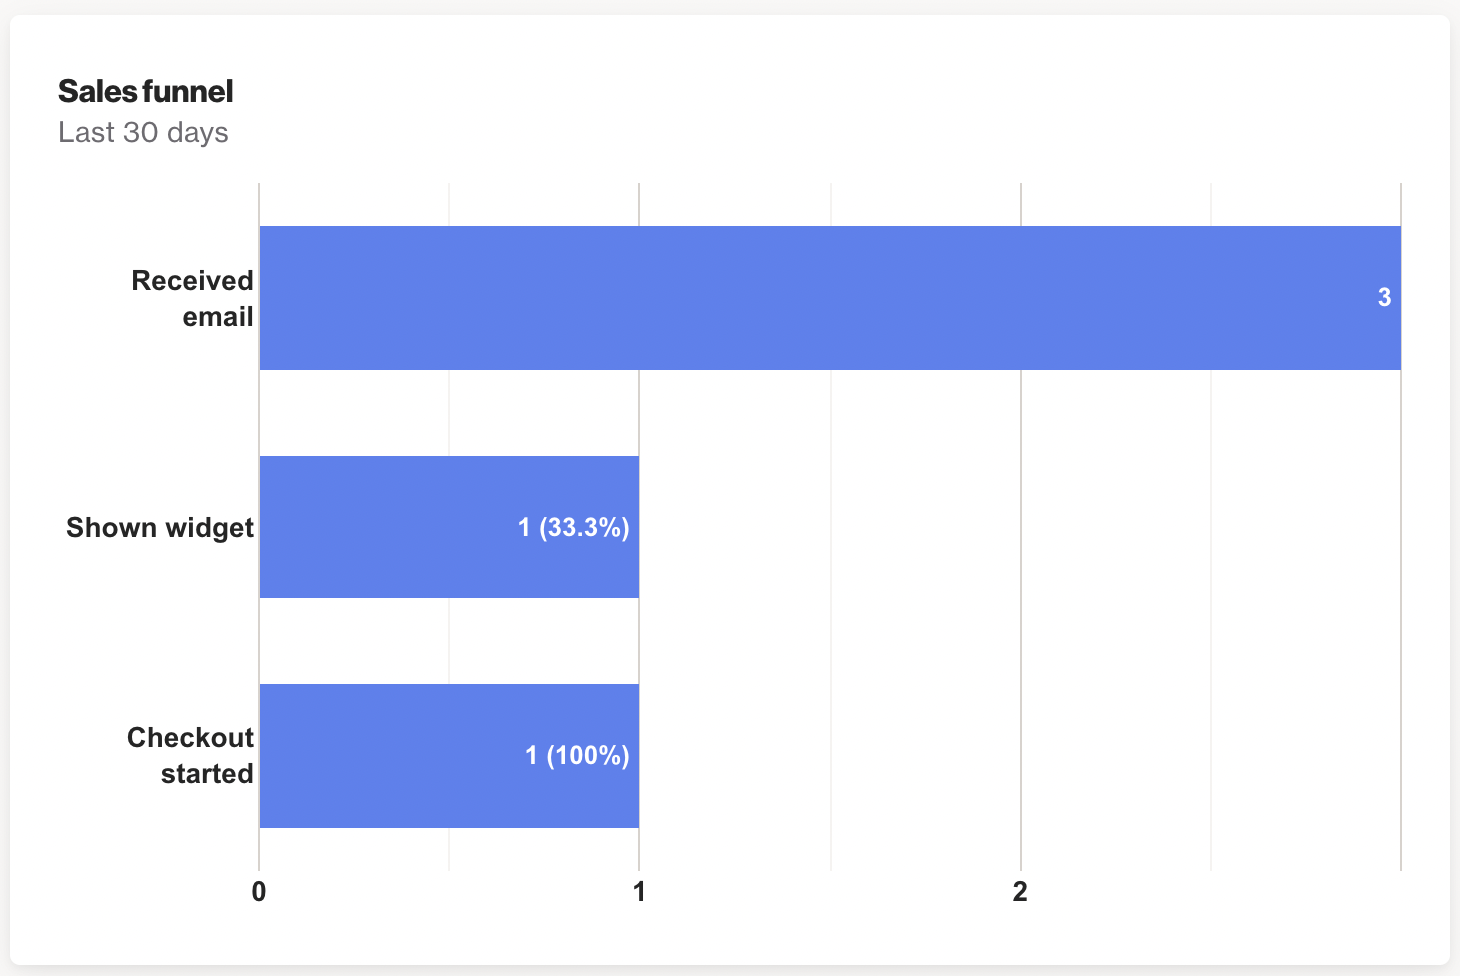
- Shown widget: 33.3% - This means that out of 3 contacts who received the email (Received email activity), the widget was shown to one contact (Shown widget activity). So the percentage is calculated as follows: (1 / 3 = 33.3%).
- Checkout started: 100% - This means that the contact who was shown the widget (Shown widget activity) has completed the last stage of the funnel (Checkout started activity). So the percentage is calculated as follows: (1 / 1 = 100%).
In summary, the percentage in each stage of the funnel is always calculated as follows:
Number of contacts in the current stage / number of contacts in the stage immediately above
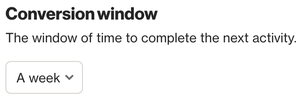
Conversion window
The conversion window determines the time the contact has to complete the next activity in the funnel.
If the contact performs the next funnel activity after the time set in the conversion window, then that contact will be excluded from the next stage of the funnel.
EX: Let's say the conversion window of the funnel report below is 1 week.
This means that if a contact takes 15 days to complete the checkout (Checkout started activity) after seeing the widget (Shown widget activity), they will be excluded from the last stage of the funnel. This is because they performed the next activity outside the time defined in the conversion window (a week in this case).
TIP: You can view the contacts included in each stage by clicking on the corresponding chart.
NOTE: This feature is not available in the preview and will only work after the report has been saved.