Include or Exclude options for Pie Chart reports
Overview
When creating a pie chart report, use the Group by option to automatically show counts for each choice without needing to create a separate metric for each one. For example, this is helpful if you want to see how many times each option in a multi-select field has been chosen. However, be aware that this may include more results than you want.
Accessing pie charts
To access pie chart reports, go to Analytics > Reports > New report.
Grouping results
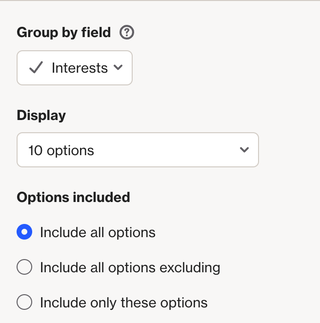
When grouping results in a Pie Chart report, you can choose from these options:
- Include all options: Shows all choices.
- Include all options excluding: Excludes specific options while including the rest. Useful if you only need to remove a few options.
- Include only these options: Shows only the options you specify. Ideal if you want to include just a few options and exclude the rest.
EX:
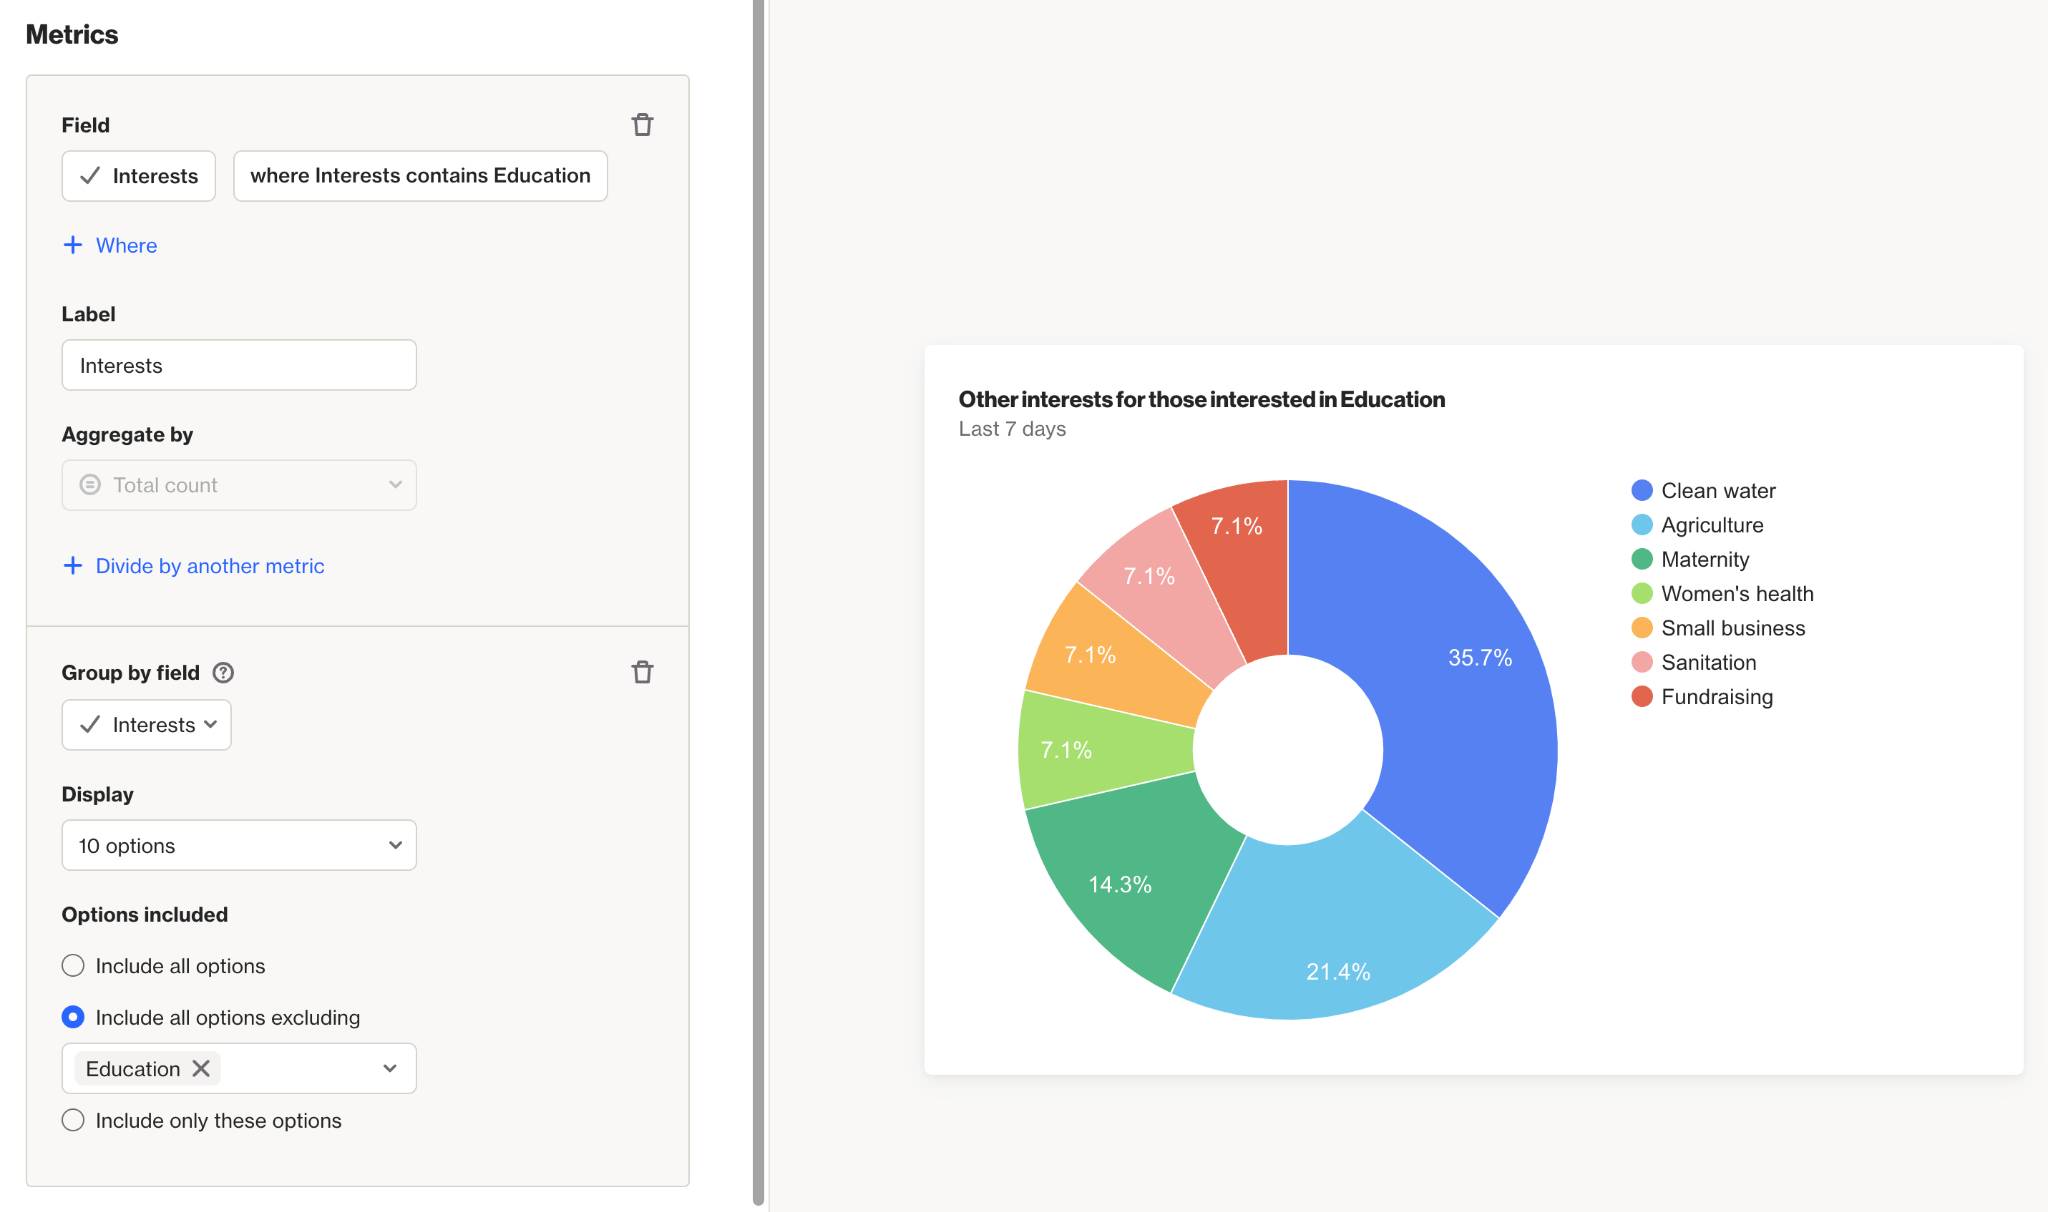
If you have a multi-select field called Interests and want to see other interests of people who are interested in Education:
- Set your Metric to Interests and add the condition where interests contains Education.
- Group the report by the Interests field.
- To exclude Education from the results (since everyone has it), choose Include all options excluding and enter Education.
The report will now display other interests of people who have Education listed.