
Create custom Talk reports
Build your own Talk reports to drill down into specific conversation metrics to find out more about your agent and customer activity.
All Talk-related activities and fields can be used as report metrics, so you can explore insights such as how saved replies are used, conversation handling time, what tags are used, customer ratings and comments, conversation sources, and more.
Here are some suggested reports you can create:
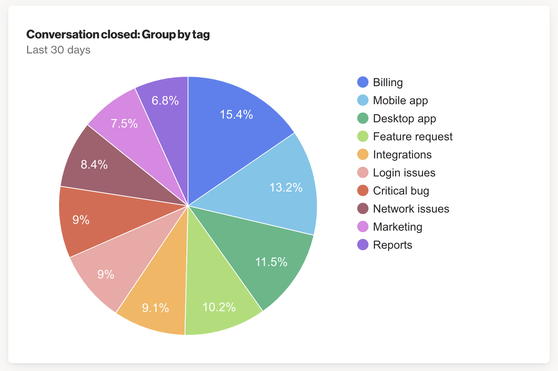
Conversation tags – Get an overview of the top issues or topics by creating a pie chart of conversation tags. Use the Conversation closed activity and group by Tags.If your Support team serves multiple geographical regions (e.g. USA, Europe, and Asia–Pacific), you could take this report a step further by filtering results by customer location (e.g. using the Country field, or a tag that identifies the person’s region) to get an overview of the most popular topics by region.
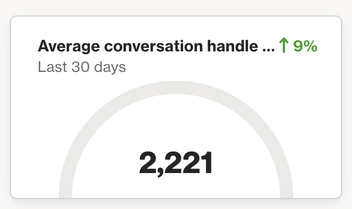
Average conversation handle time – Use the Conversation closed activity, and aggregate by Average of attribute, where the attribute is Conversation time in minutes. You could also use this to create an average handling time report for each agent in your Support team, or each geographic region your Support team serves.
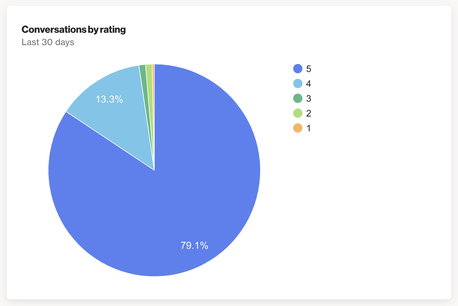
Conversations by rating – Create a pie chart showing results for the Conversation rated activity grouped by Rating for an overview of customer sentiment.
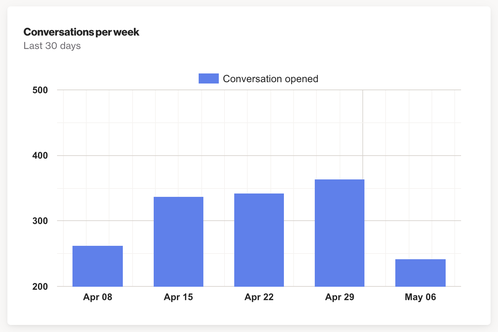
Conversations per week – Create a column chart showing results for the Conversation opened activity with a precision value of Weeks for an overview of your conversation volume each week.
When you've created Talk reports, you can add them to the Talk dashboard.